The SIR model is an extremely simple model of an infectious disease in a population that breaks the population into three groups: susceptibles, infecteds, and recovereds. I was having issues getting matplotlib running, so I ported the code in Modeling Infectious Diseases in Humans and Animals from Python to R.
It turns out that it’s really easy to create the model using the deSolve library. Here’s the code:
library(deSolve)
sir <- function(time, state, parameters) {
with(as.list(c(state, parameters)), {
dS <- -beta * S * I
dI <- beta * S * I - gamma * I
dR <- gamma * I
return(list(c(dS, dI, dR)))
})
}
init <- c(S = 1-1e-6, I = 1e-6, 0.0)
parameters <- c(beta = 1.4247, gamma = 0.14286)
times <- seq(0, 70, by = 1)
out <- as.data.frame(ode(y = init, times = times, func = sir, parms = parameters))
out$time <- NULL
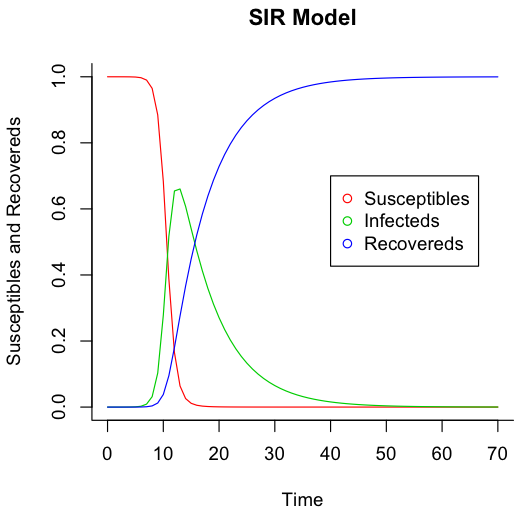
matplot(times, out, type = "l", xlab = "Time", ylab = "Susceptibles and Recovereds", main = "SIR Model", lwd = 1, lty = 1, bty = "l", col = 2:4)
legend(40, 0.7, c("Susceptibles", "Infecteds", "Recovereds"), pch = 1, col = 2:4)
And here are the undeniably impressive results: